MRec
This post is also available on:
![]()
In the upper part of the screen, the monthly MRec result of the milk yield test is shown. If accounting units (BU or stables or other units are recorded separately, they can then be selected.
The cell counts are color-coded if the limit value is exceeded:
Evaluation of milk control results for
- Animals
- Groups
- Comparison of last MRec and graphics
- Year-on-year comparison
- Evaluation of monthly results
- Moving Average & Graph
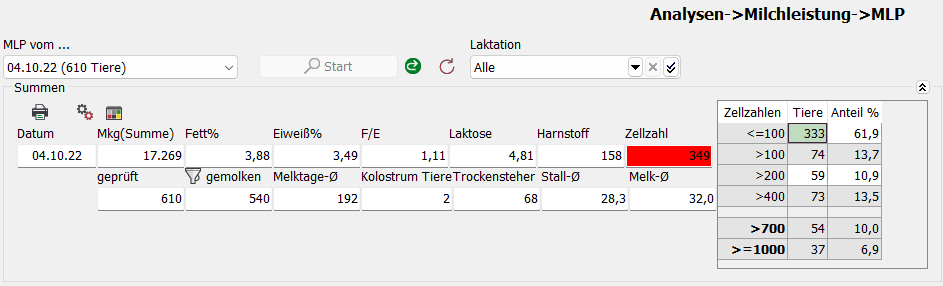
If there are no cell counts in the MRec , the cell count overview is not displayed.
 | Print current MRec
 | Settings – SCC Groups
 | Settings – Limits (SCC)
Settings – SCC Groups

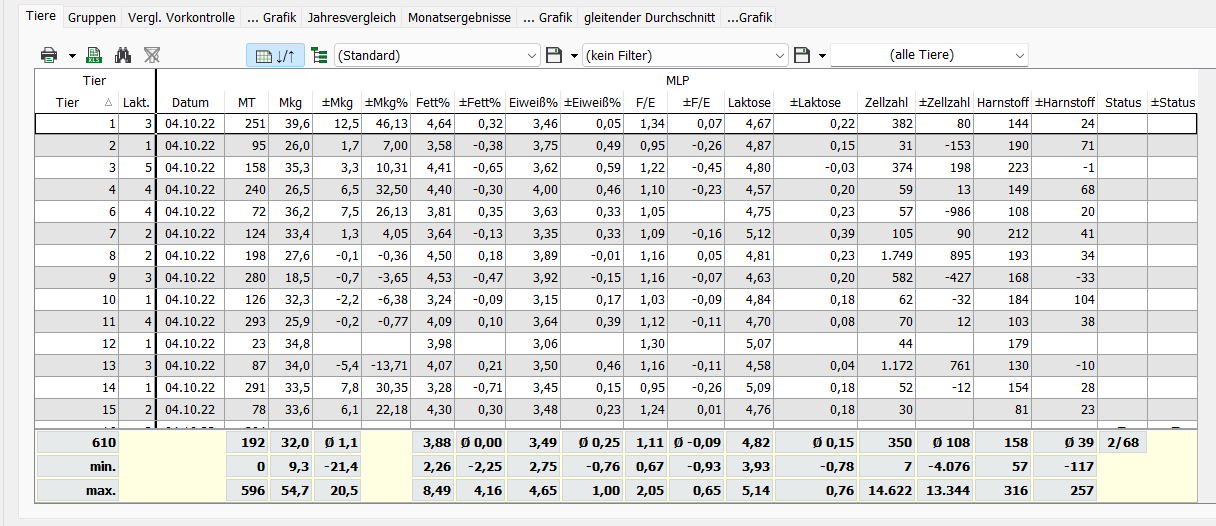
Animals
 | Display Minimum / Maximum
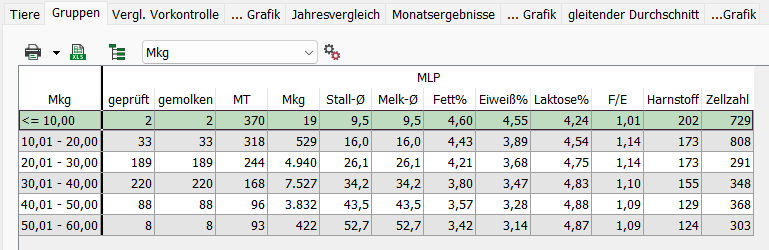
Groups
Evaluation of animals
- Groups
- Feed groups
- Lactations
- Milking days
- Mkg
| Settings (Mkg or milking days)
Comp. last MRec
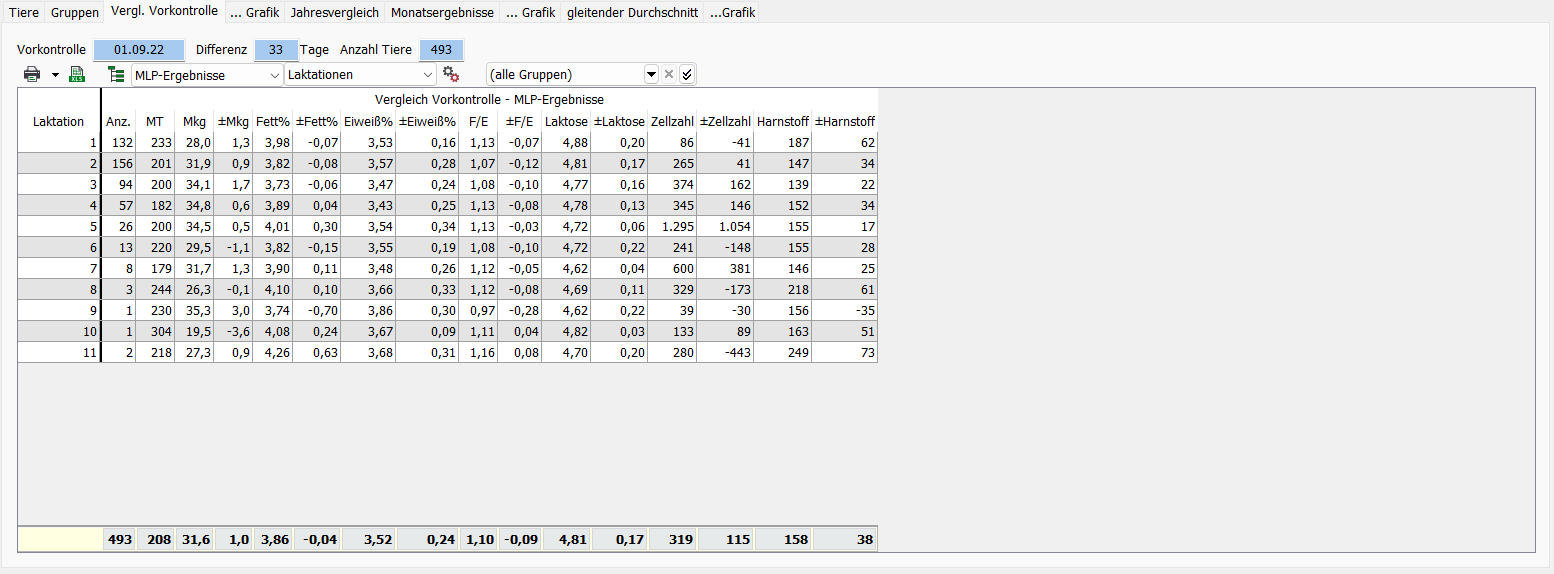
Only animals with milk quantity at the last MLP are compared here, the selection can be considered both on the MRec results and on the SCC .MRec The tabular presentation is possible according to the following criteria. In addition, the housing group can be restricted.
- Groups
- Feed groups
- Lactations
- Milking days
- Mkg
Hint: In all comparisons with the previous month, only those animals that have a performance in both MRec (Mkg>0) are taken into account.
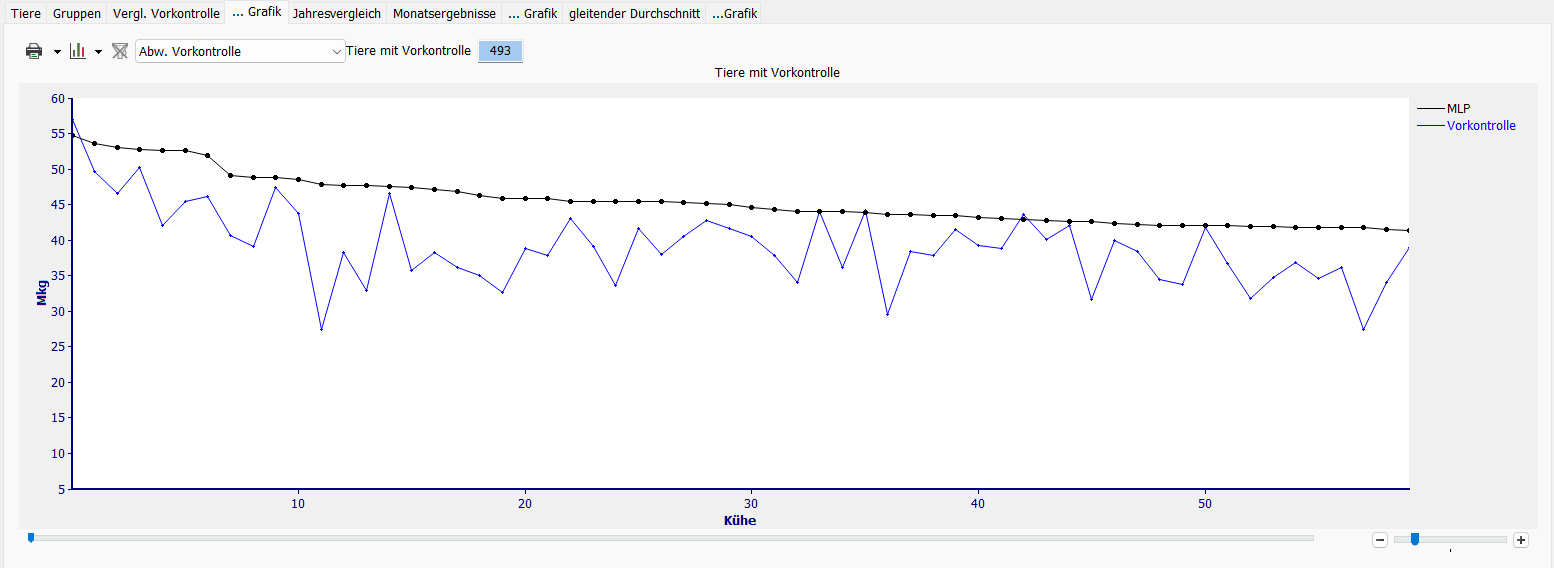
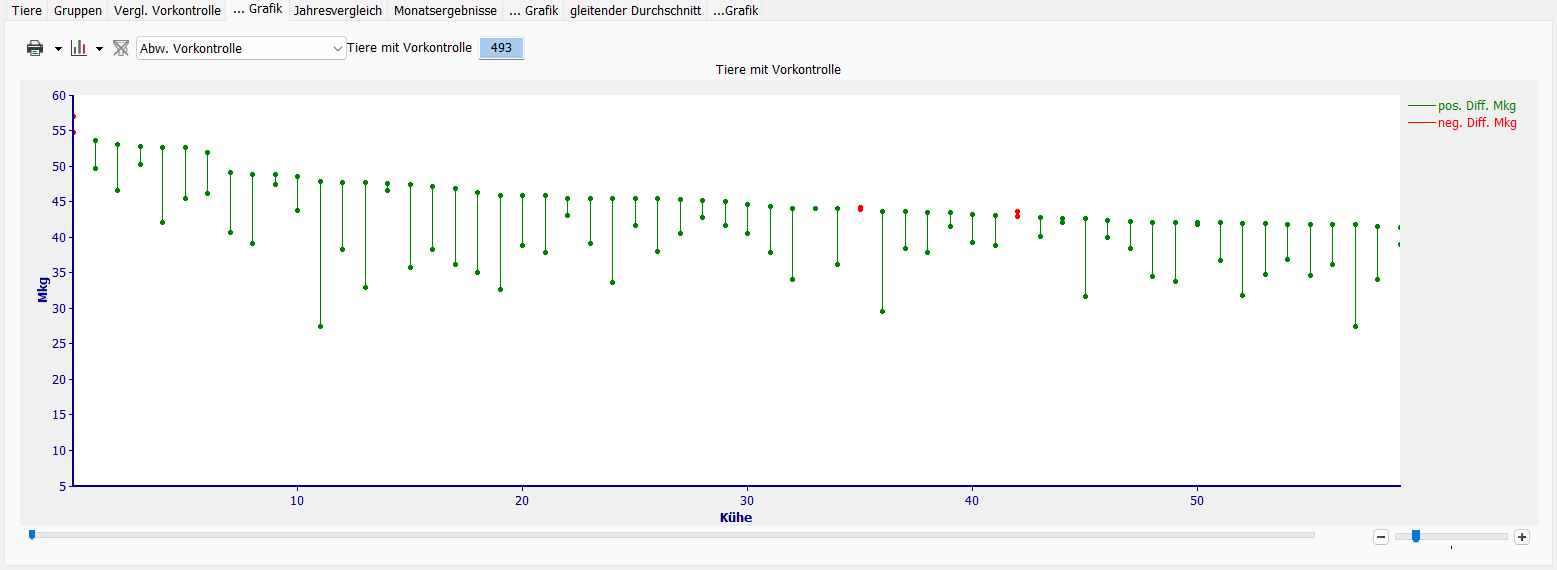
… Chart
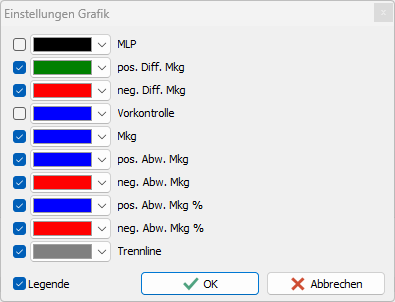
well-known representation of the change from pre-controlto Act. MRec
If you deactivate the display for MRec and pre-check and leave the settings as in the picture, the length of the vertical line results in the pos. Difference from the last MRec or the neg. Difference to the current MRec the change in Mkg.
Complete display of the animal population (right scroll bar at maximum)
if the selection is shorter, the focus can be changed with the slider under the X-axis (cows).

Representation of the deviation (pos./neg.) from the last MRec to the current MRec in Mkg, animals can thus be easily selected.

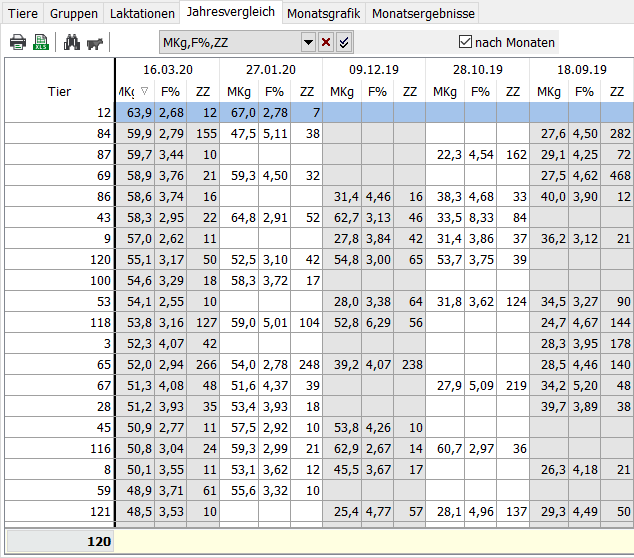
Year-on-year comparison
… Chart
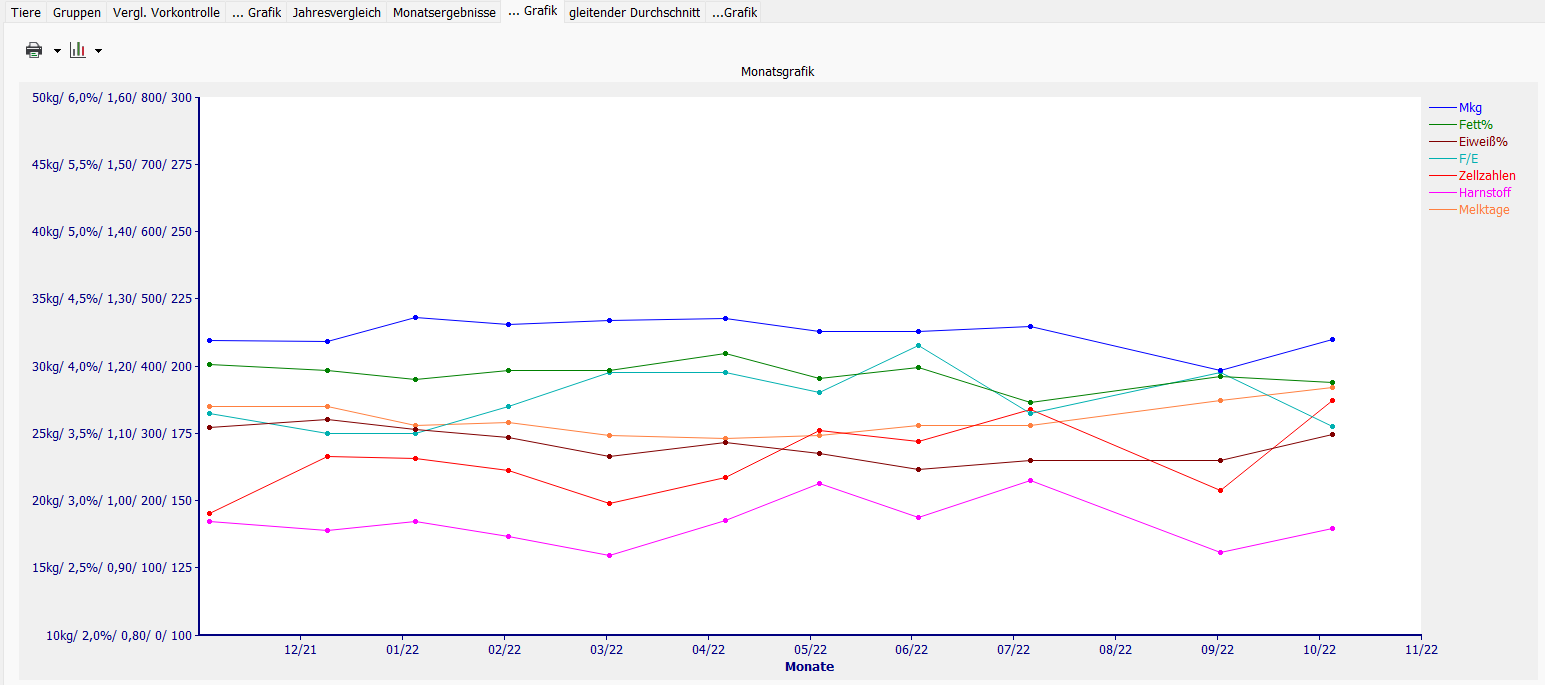
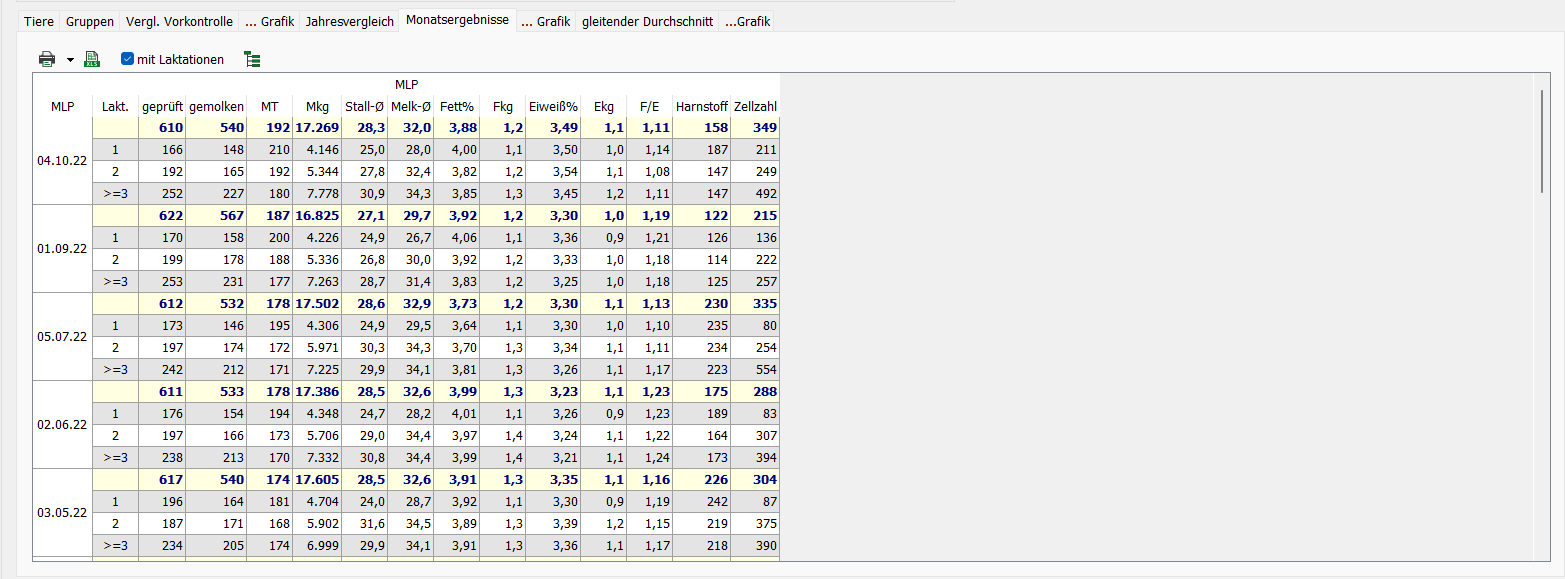
Monthly results
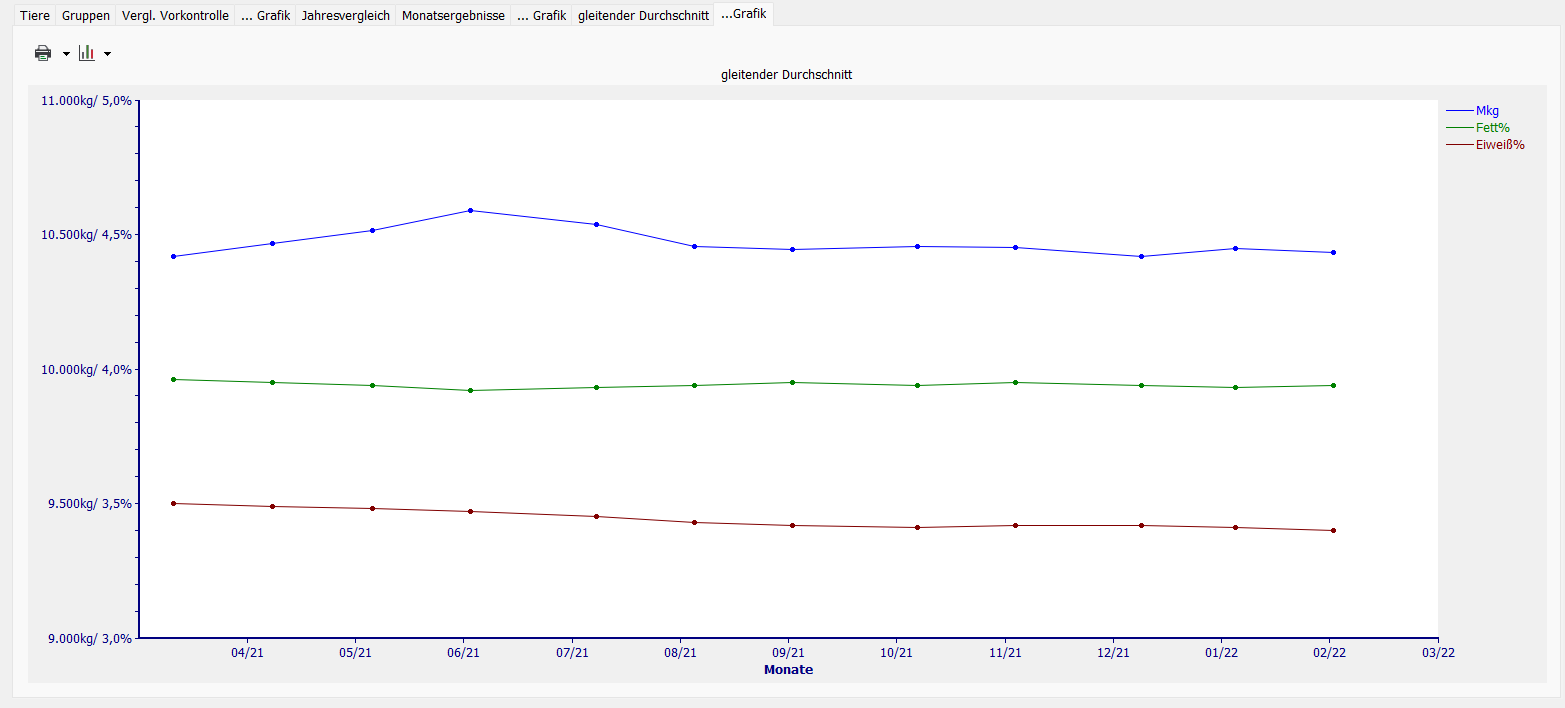
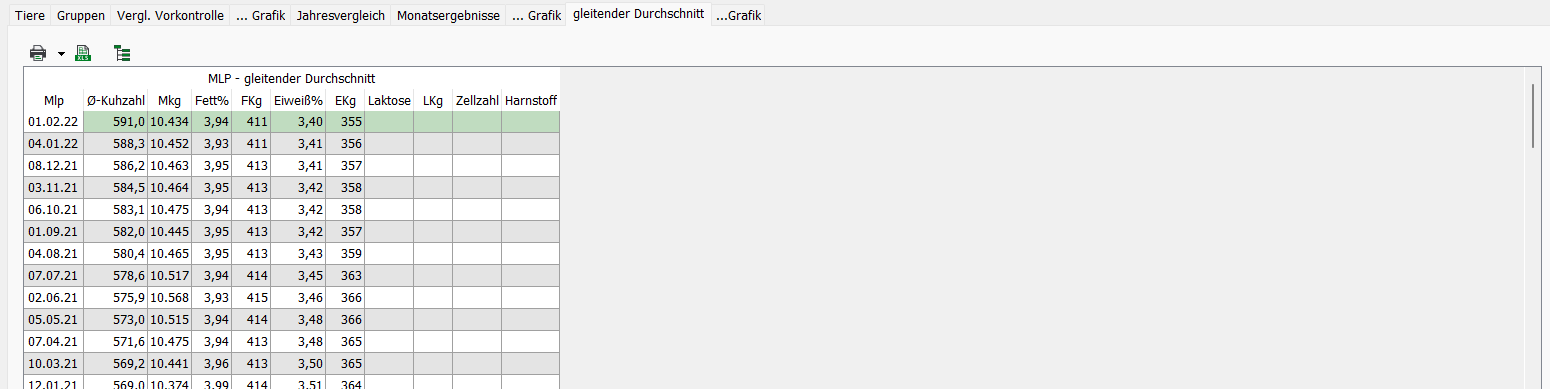
Moving average
The moving average is the average performance of the HERDEplus over the past 12 months. It illustrates the development of the HERDEplus in terms of population and performance development. The development is presented by the program in graphical and tabular form.
… Chart