Urea report
This post is also available on:
![]()
* Controlling module, requires activation via the license
The graphical representation of the nutritional status based on the protein/urea values gives an overview of the entire stock and makes trends in the individual lactation stages clear. The choices correspond to those of the tabular display.
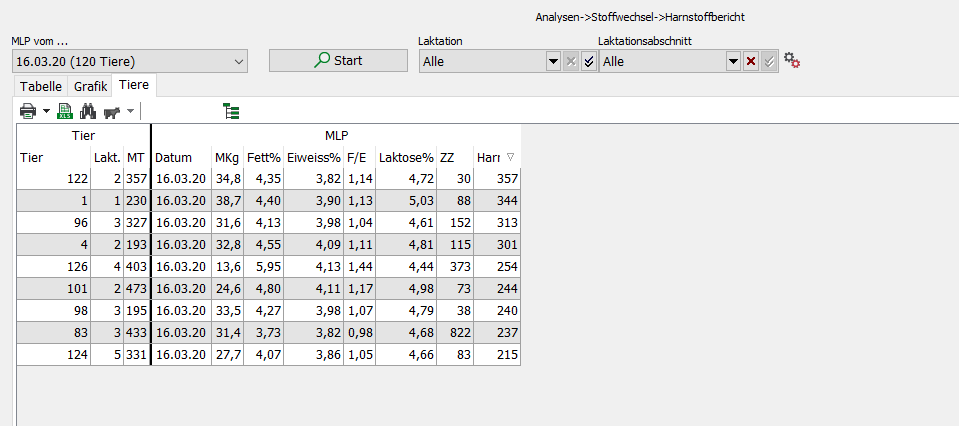
By marking the points in the graph with the mouse (press the left mouse button, hold and circle the desired points, release), the animal list Nutritional Status is displayed
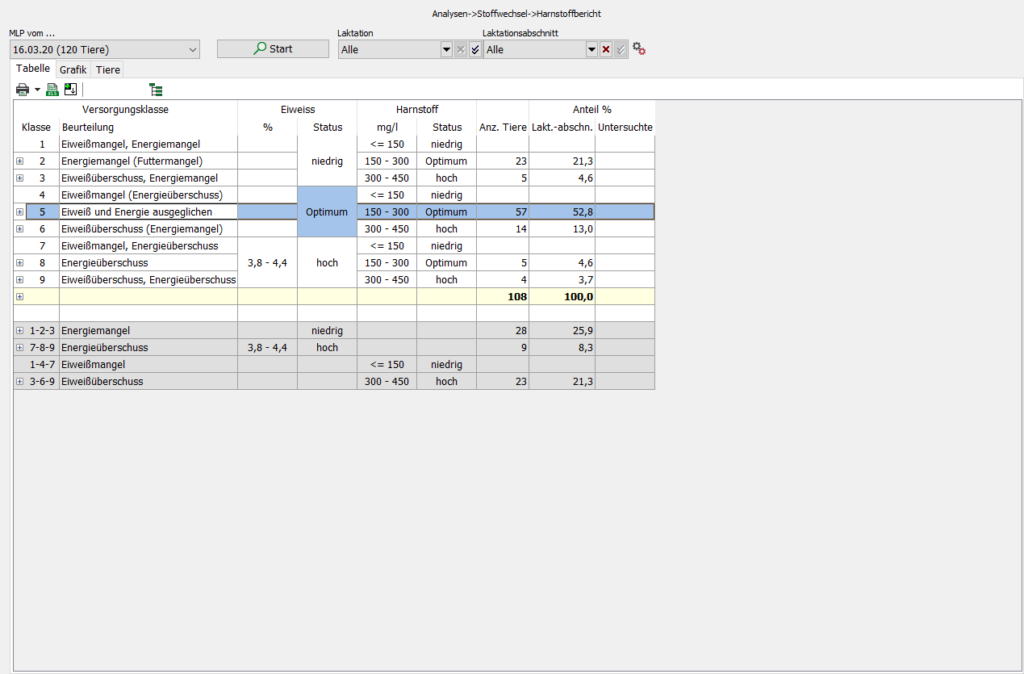
The following subdivisions are the basis of the urea report
| Protein deficit, energy in excess | Energy in excess | Protein in excess, energy in excess |
| Protein deficit, (energy in excess) | Protein and energy balanced | Protein in excess, (energy deficit) |
| Protein deficit, energy deficit | Lack of energy (feed deficit) | Protein in excess, energy deficit |


The animal list can be filtered interactively by dragging a “square” around the points to be selected with the left mouse button.
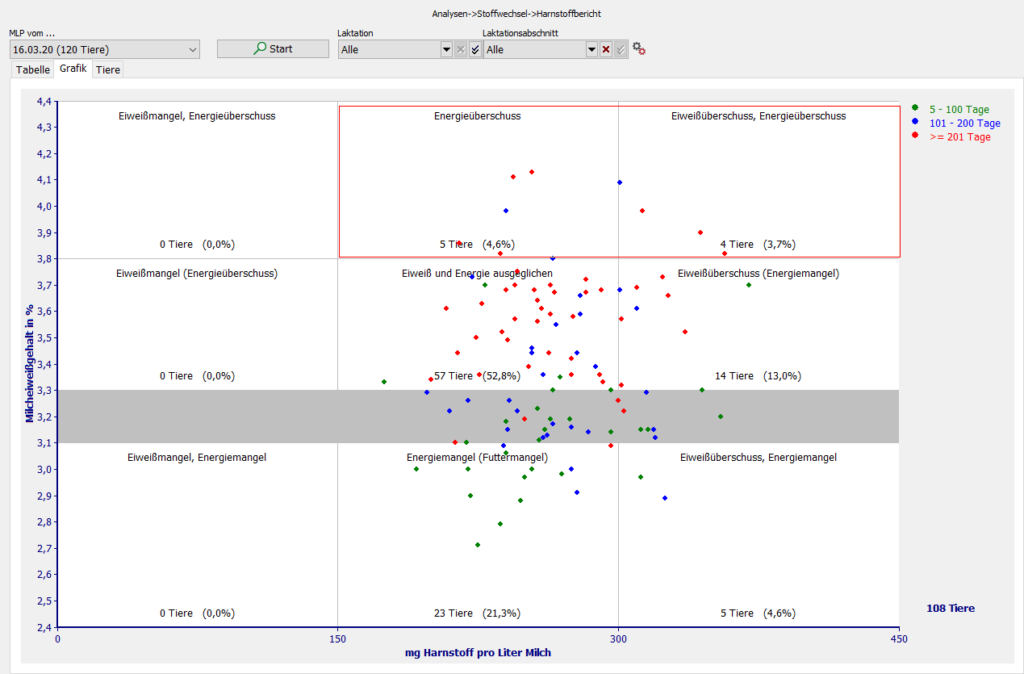
If you release the mouse button, the animals that are within the selection are displayed
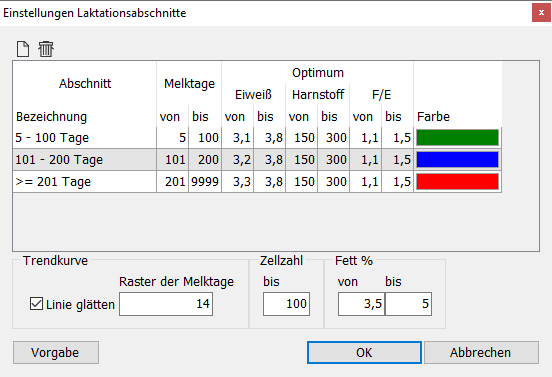
 | Setting lactation period