MRec Overviews
This post is also available on:
![]()
* Controlling module, requires activation via the license
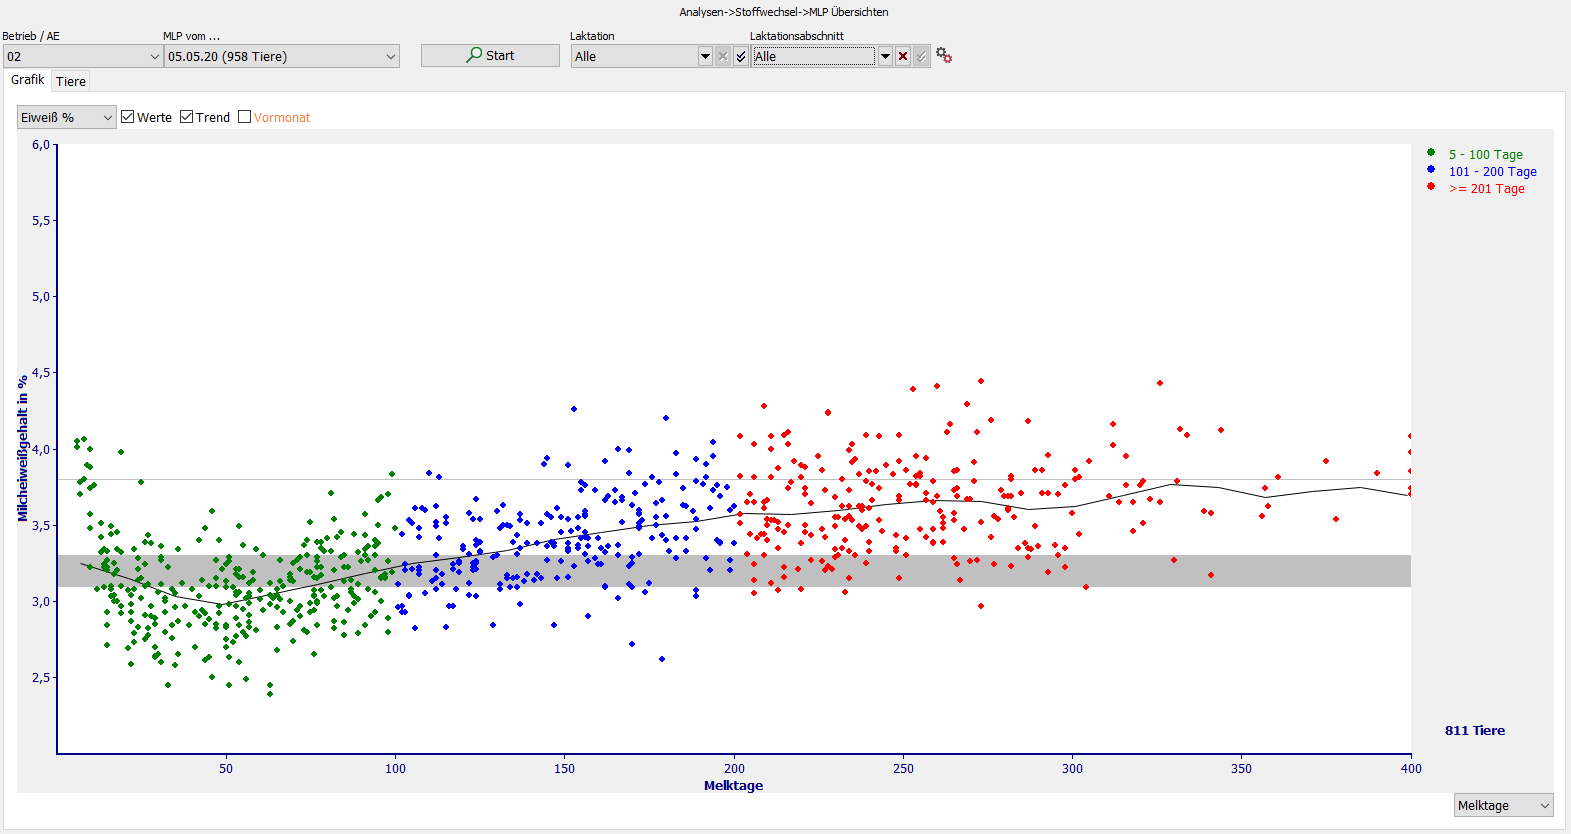
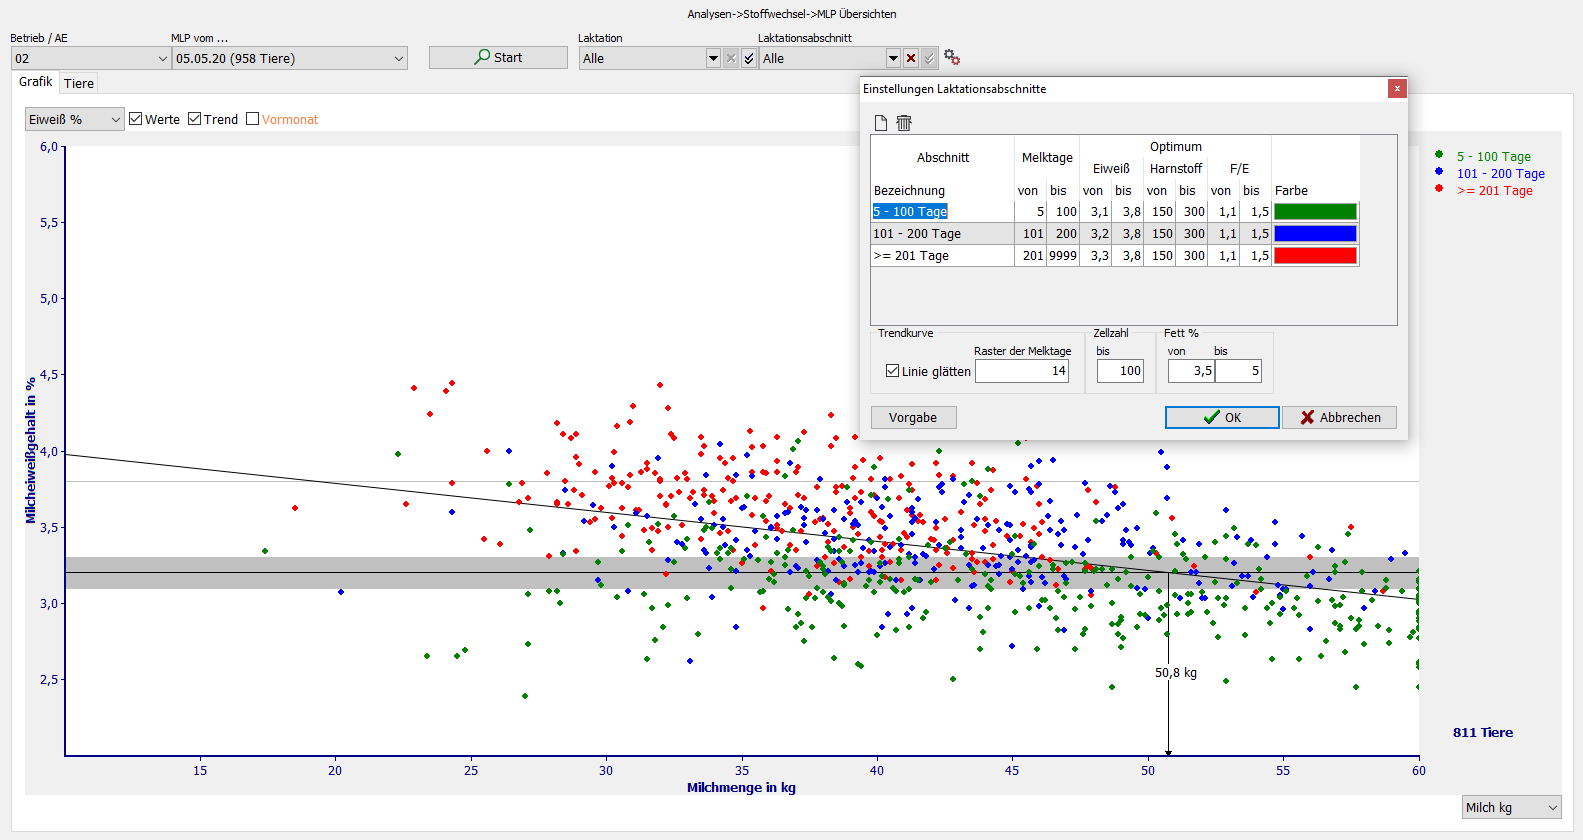
In this evaluation, two of the key figures milk–kg, fat percentage, protein percentage, urea, the fat/protein quotient and, on the x–axis, the milking days, can be set in relation to each other for an MRec in a two-dimensional graph. The point cloud illustrates the dispersion of the values. Optionally, a linear trend line can be laid through them. In settings, standard ranges or lines can be defined for the code numbers.
This analysis is a point cloud representation of the MRec results on X or Y axis
- Quantity of milk
- Fat percentage
- Protein percentage
- Urea
- Somatic Cells Count
- Fat/protein quotient
- Milking days (X-axis only)
An animal selection is made by dragging a “square” with the left mouse button around the points to be selected in the graphic.