Intensive analysis
This post is also available on:
![]()
* This module is only included in the Premium subscription.
For a detailed analysis of the most important production key figures, it is possible to follow comparisons and developments here. To do this, you can display animals in intensive analysis from any table with the function  File >
  Animals in Intensive Analysis or the toolbar button Animals in Intensive Analysis .
- arbitrary animals (CTRL+LMB) or (SHIFT+LMB)
- all animals (CTRL+A)
- filtered animal list
- Animals from the marking list
- Animals from the work lists
- Animals from problem animal lists
- all analyses
- universal analysis
- Univers
Hint
If animals from one of the above lists are present several times, the animal is only included in the intensive analysis once, with the last lactation.

Menu
 Comparison | only if comparison is available, switch off comparison
 Print
Print Save selected curves and X/Y axes Parameters suitable for quick change with
  save under your own name
 Setting Display Graphic
- | Grid X/Y Grid
- Hint | Note on the cursor or crosshairs
- 0-10 | Y-axis (0-7, 0-10, 0-15)
- 0-450 | X-axis (0-450 days, 0-600 days)
- Animal group | Name of the animal group
 Edit | change the name of the animal group (3 lines max.)
 Last lactation | only animals that are in the current selection 2.Lactation and larger are possible
 act. Lactation | act. Yields
 next lactation | Animals without departures and where benefits are available
 Excel Export
 Settings
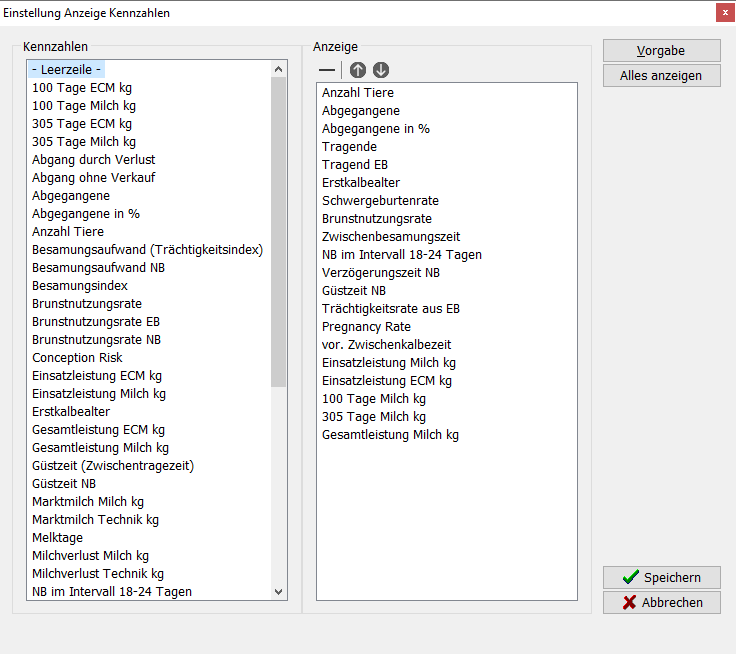
- Key Figures Settings
- Display
- All
- value
- Number
- Show difference
- Group | by key figures complex
 Settings Limits
 Comparison | set up
 - Last lactation | for comparison
- act. Lactation | for comparison
- Next lactation | for comparison
 Delete | of the comparison
Setting Display Graphic
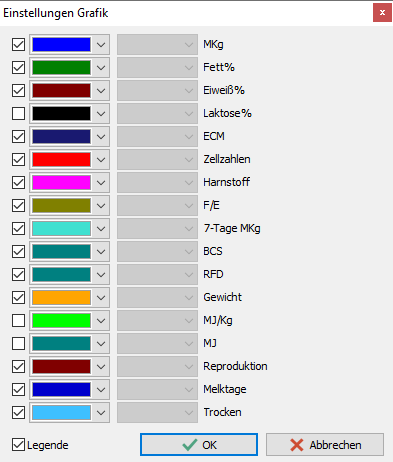
Mkg
Fat%
Protein%
Lactose%
ECM
SCC
Urea
FPR
7-day MKg
BCS
BFT
Weight
MJ/Kg
MJ
Fertility
Milking days
Dry
100 days ECM kg
100 Days milk kg
305 daysECM kg
305 Days milk kg
Leaving due to loss
Leaving through sale
Leaved
Leaved in %
Number of animals
Insemination costs (pregnancy index)
Insemination costs SS
Insemination index
Heat utilization rate
Heat utilization rate FS
Heat utilization rate SS
Conception risk
First yield ECM kg
First yield Milk kg
First calving age
Total ECM kg
Total milk yield kg
Days open (intermediate pregnant period)
Days open SS
Market milk Milk kg
Market milk technology kg
Milking days
Milk loss Milk kg
Milk loss technology kg
SS in the interval 18-24 days
Peak milk ECM kg
Peak milk kg
Pregnancy Rate
VWP
Heavy birth rate
Waiting period days
Stillbirth rate
Pregnancy rate FS
pregnant FS
pregnant
Dry
Delay time
Delay time SS
prosp. VWP
prosp. Dry
prosp. Calving interval
Intermediate insemination period
Intercalving period
Intercalving period (pre-lactation)
Display Leaving
Types of leaving
Slaughter
Emergency killing (alive)
Died
Sale for breeding
Home slaughter
Sale for fattening
Emergency killing
Export
Direct
Reasons for leaving
Sale Breeding
Age
Performance
Infertile
other diseases
Milking
Claws
other
Metabolism
Farm